
The ST EDGE Assessment starts from the closed days, computes 15 metrics and compares them with thresholds written in advance and fitted to the declared way of trading. Out come a 0 to 100 score, how precise it is and a position on the scale for the operator type. The method is the same for a year, a quarter, a month or any two dates.
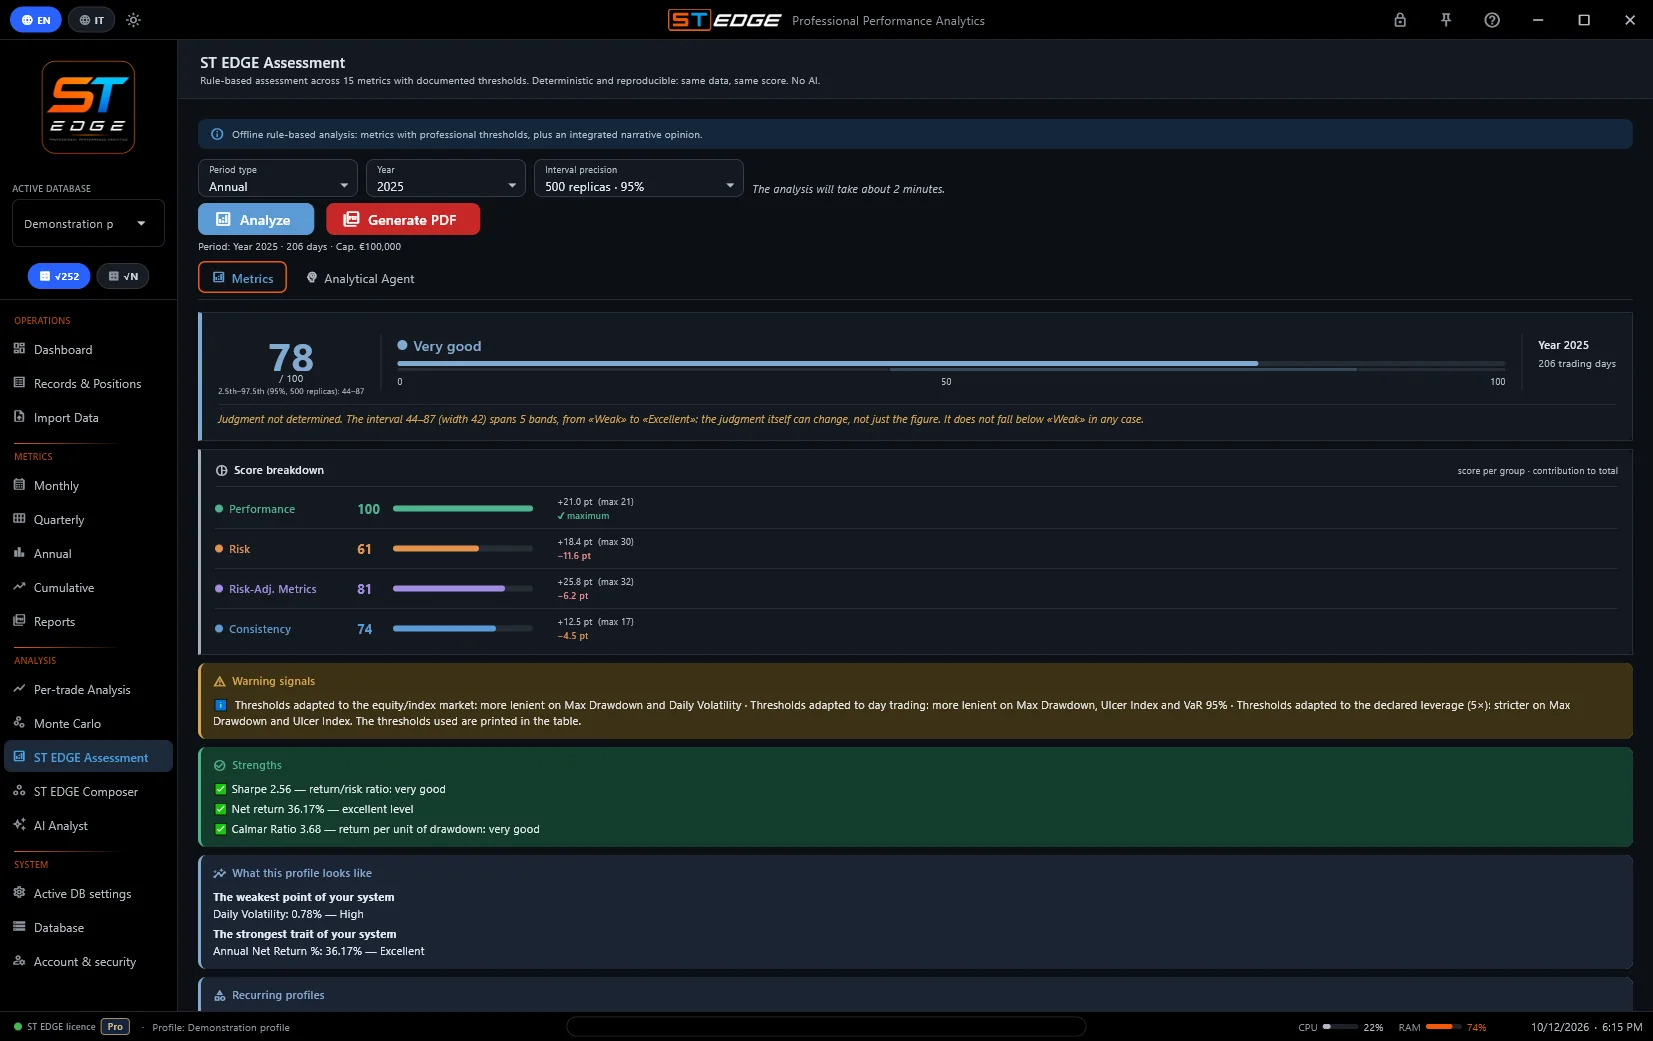

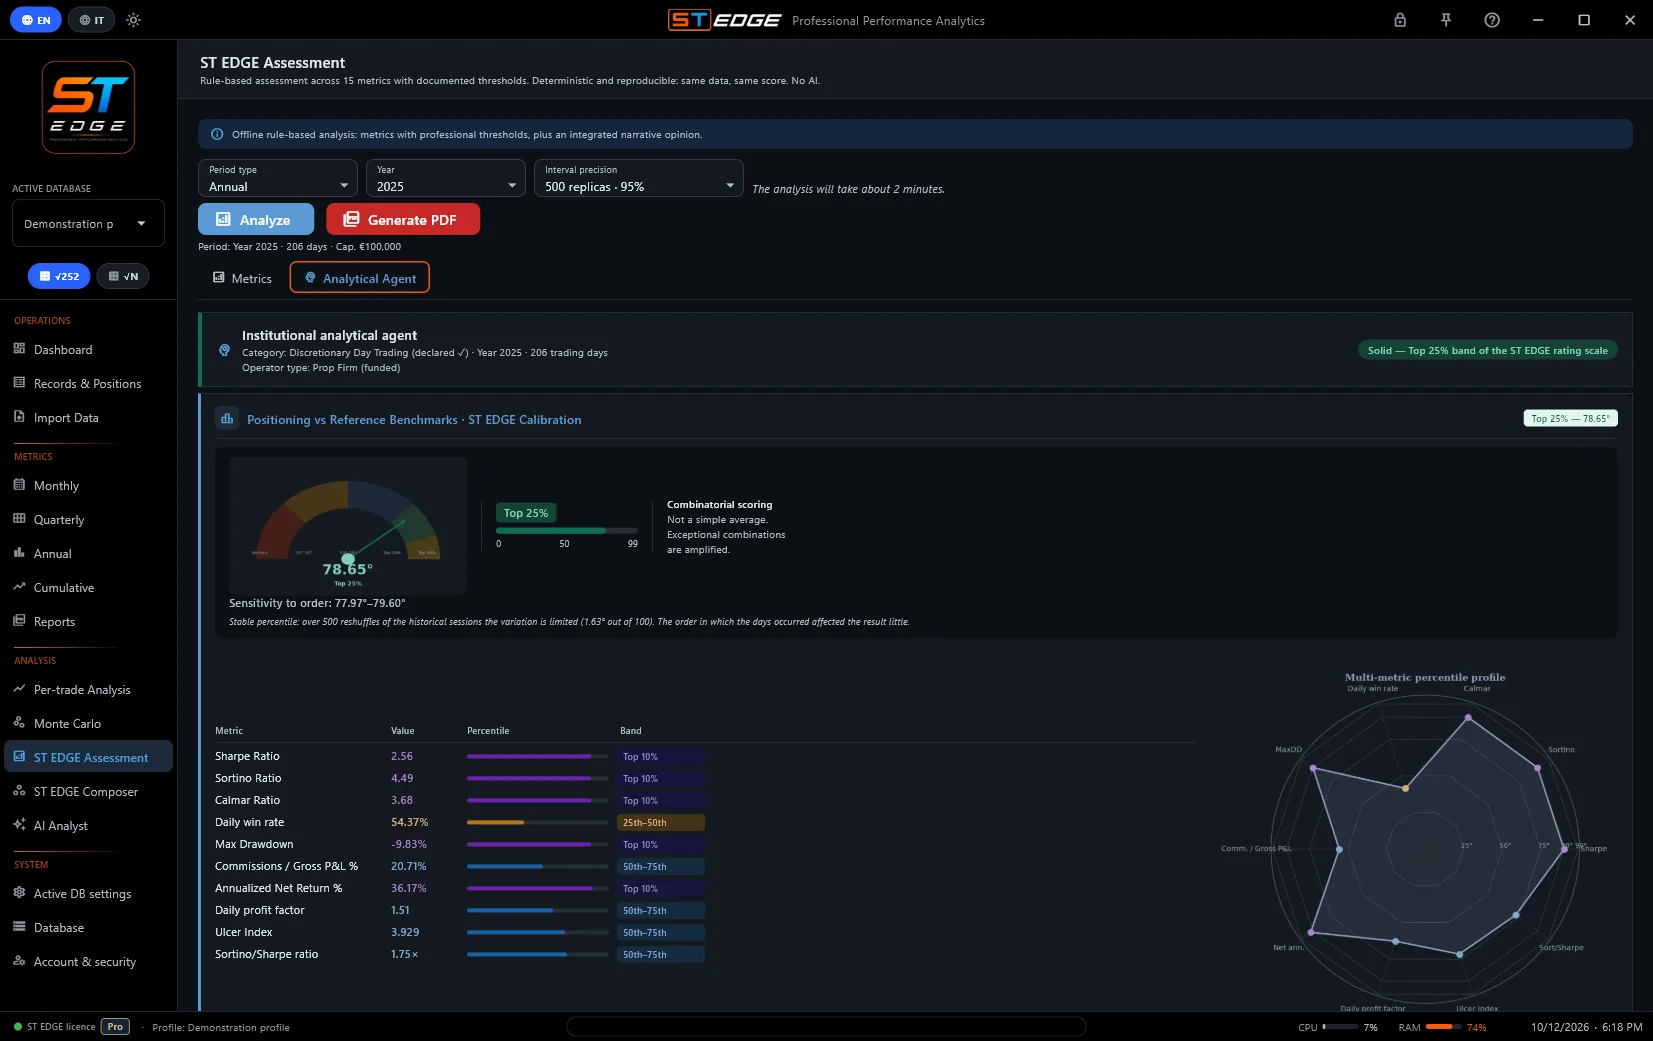
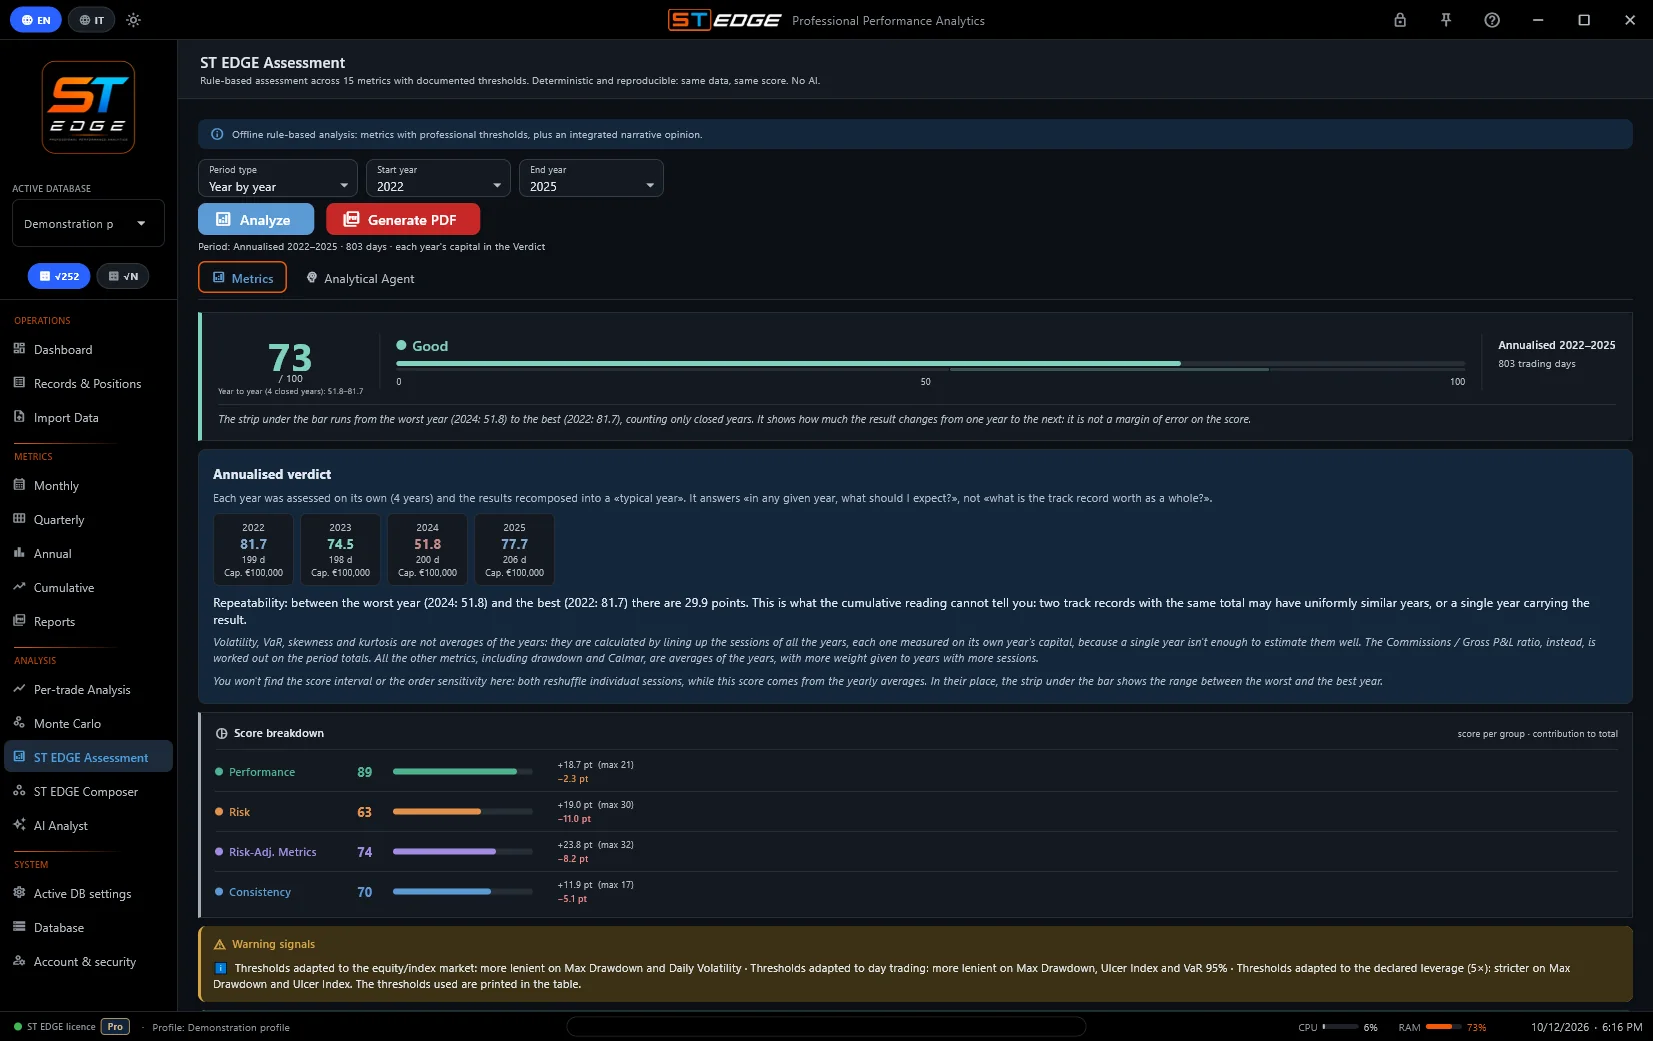
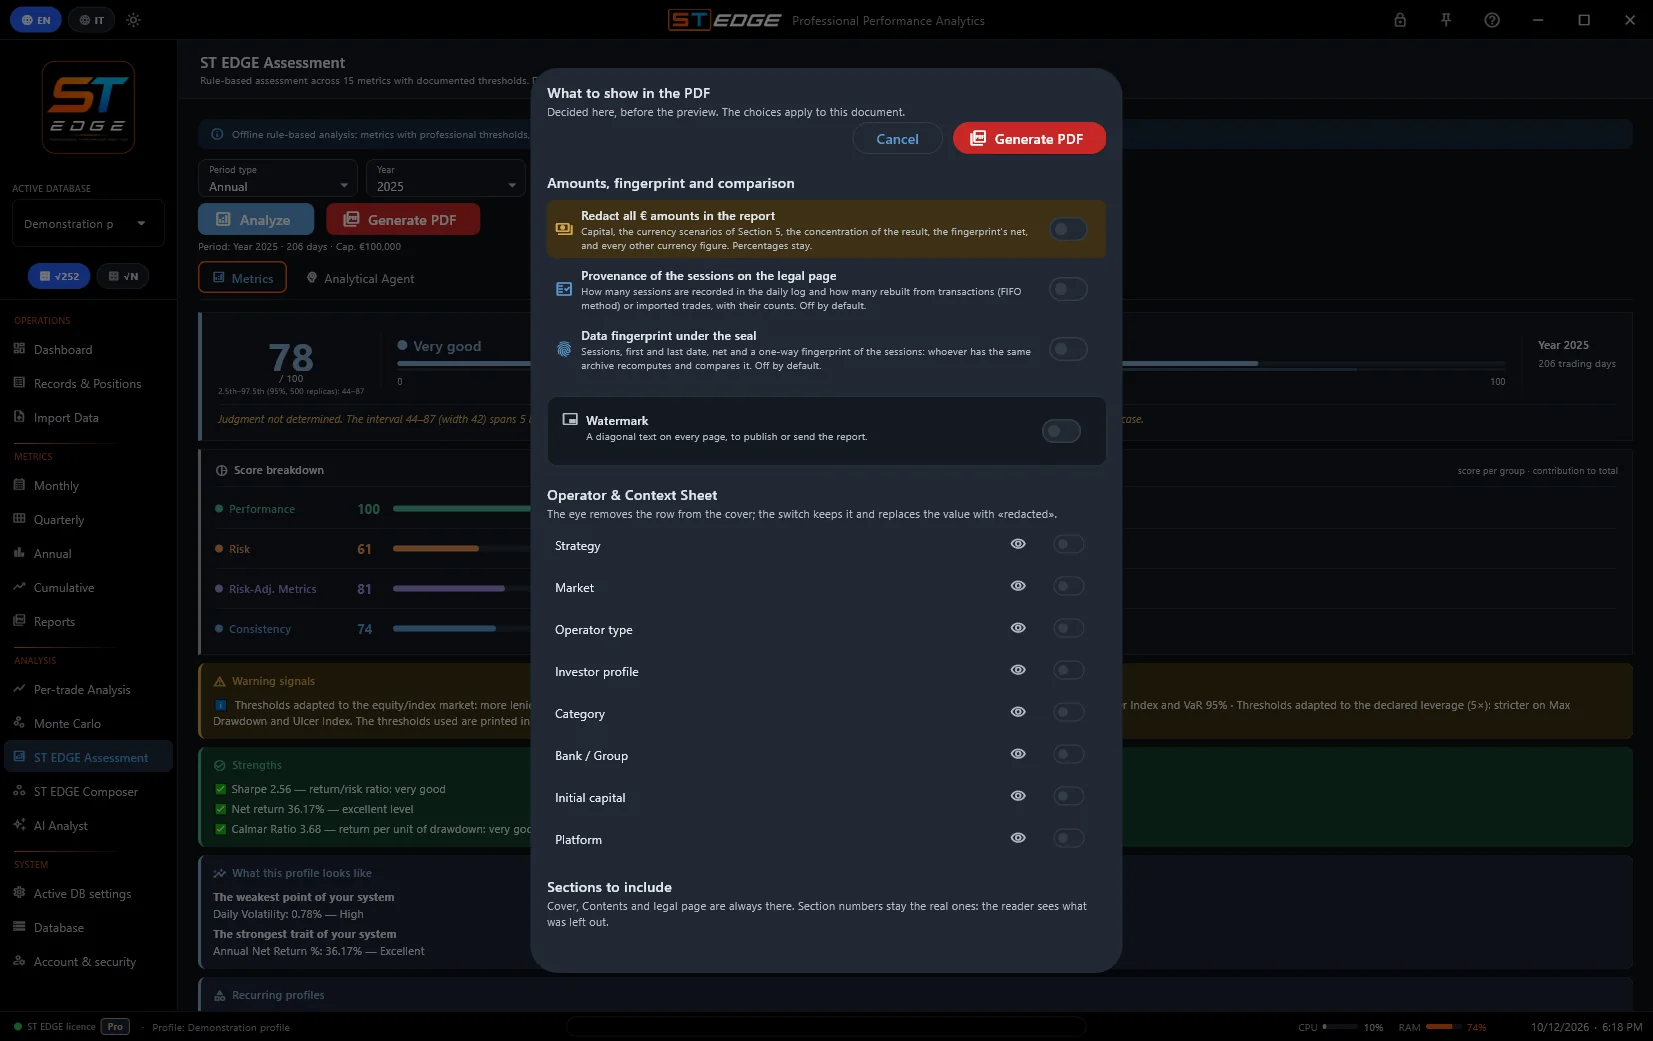
Each group answers one question and weighs differently on the score: Risk and Return / risk count more, and the exact weights aren't published. No metric is enough on its own: a high return with a huge drawdown, or a very high win rate with rare but heavy losses, are fragile profiles that a single row doesn't show. That's why the score weighs them together.
«How much did the capital return?»
What the capital returned over a year, with every cost already taken out. It is the only metric in the group.
«How much risk did the result cost?»
The largest loss from the highest point reached, measured close to close. Declared leverage tightens the threshold.
How far the equity fell and how long it stayed down. Max Drawdown is a single episode, this looks at the whole path.
How much results swing from one day to the next. It doesn't say whether money is being made, it says how bumpy the path is.
Where the bad days begin: one day in twenty went worse than this.
Which way surprises lean. Positive means the big moves are gains; negative means many small wins and a few very bad days.
How often extreme days happen, either way.
«Was the gain worth the risk?»
Return per unit of swing, up and down alike. The higher it is, the smoother the path to the gain.
Like Sharpe, but it only counts downward swings: very good days aren't a risk.
Annual growth measured against Max Drawdown. It is judged only on a period of at least one year that has already closed.
How much is earned for every unit of currency lost, counted by day. 2 means twice as much.
«Did it happen regularly?»
The share of days closed in profit. Days, not trades: a winning day can contain many losing trades.
The same question over weeks: trading weeks, or Monday to Sunday for crypto.
The same question over months. It tells steady earners from occasional ones.
The longest run of winning days in a row.
What the score isn't. It isn't a forecast of future returns, it doesn't certify the data and it isn't a ranking among traders: it's a summary of the 15 metrics over the observed period, to be read together with the rows behind it and its precision interval.
Thresholds are not the same for everyone. The market, style and leverage that are set move the risk and regularity thresholds: a drawdown that's normal on futures isn't normal on bonds, and leverage tightens the limits on Max Drawdown and Ulcer Index. Ratios, return and costs use the same thresholds for everyone. Each row shows the value, the metric's 0 to 100 score, the band reached and the direction («higher is better», «lower is better»). The numerical band limits are part of the methodology and aren't published.
Costs don't vote. The net return has already taken them out, and under Performance a line of facts shows gross, cost weight and net. Sharpe, Sortino and volatility follow the calculation basis chosen: annual (√252, or 365 days for crypto) or recorded days only (√N). On short periods the return is scaled to a year in proportion to the days, only so the same thresholds apply; the report always prints the period's real return.
When a metric can't be defined, ST EDGE doesn't print a meaningless number. It shows n/a, the reason and the current value. The metric drops out of the score and its weight moves to the others, so the grade isn't pulled down where there isn't enough data.
With only a few days, the number is shown but doesn't count yet. Sharpe and Sortino count towards the score from 30 recorded days; Ulcer Index, skewness and kurtosis from 60. Until then the row shows the current value and when it will start to count, since on so few days it would have no statistical meaning.
The full Assessment is available from the Premium plan; on Base the Dashboard shows a summary of it. During the beta it's open to everyone.
The beta is free until 31 March 2027 with every feature open. Every screen is explained in the manual.