
ST EDGE organises the data into independent profiles and brings them together in consolidated portfolios. The Composer tries the combinations of the user's systems and judges each one as a real portfolio, with the same ST EDGE Assessment framework and the same 15 metrics it uses for a single account. The proposals shown come out of that verdict.
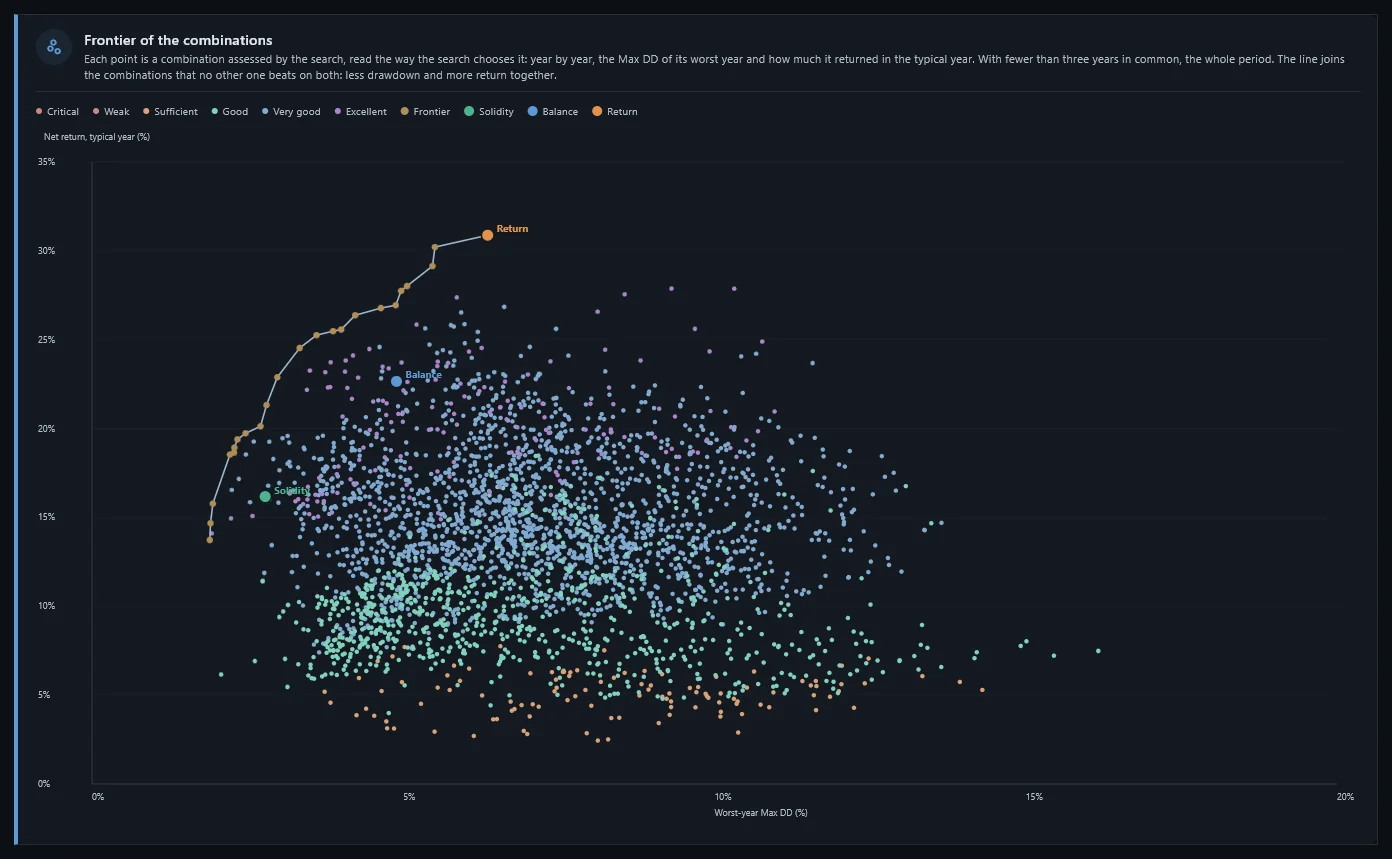
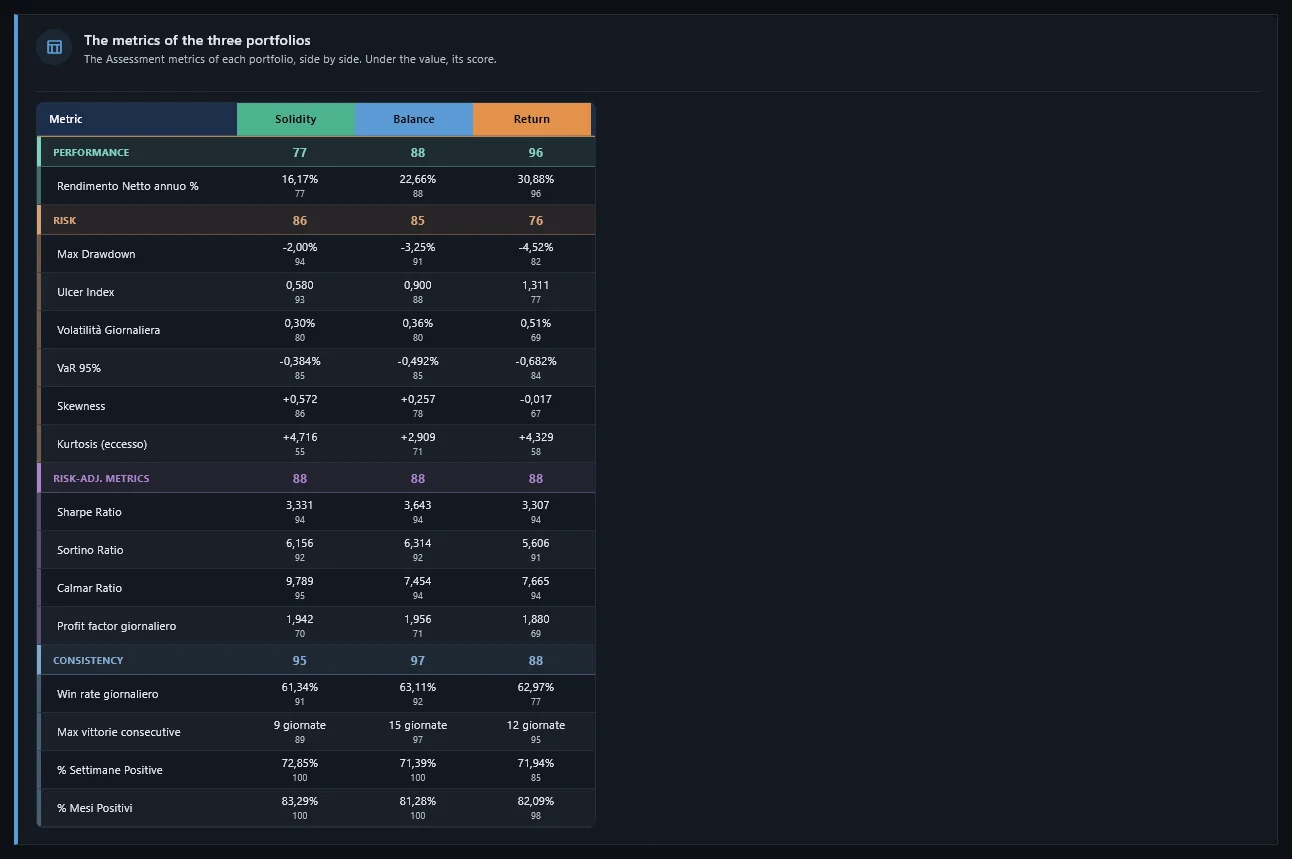
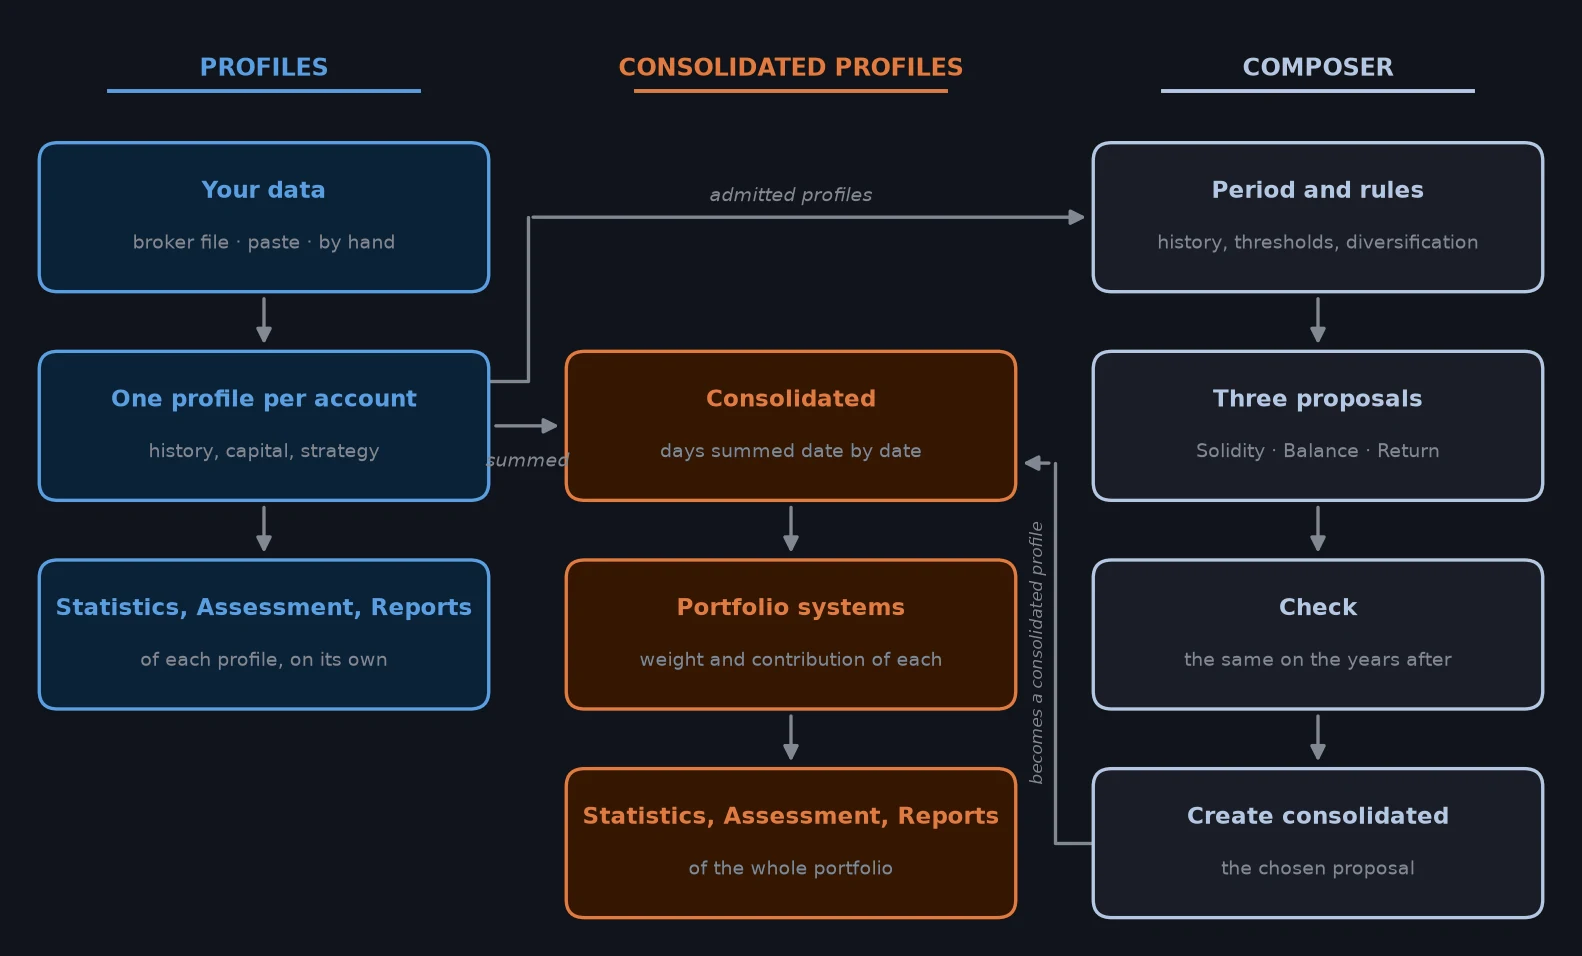
Each combination gets a 0 to 100 score and a grade for each group, computed as for a single system. If the profiles share at least three years, the combination is read year by year, as in the Assessment's year-by-year reading: the bands look at the typical year, with the whole period and the worst year shown next to it. The Composer's three criteria read those grades, so a threshold like «Risk at 70 or more» means exactly what it means in the Assessment. A profile enters the search if its Assessment is at least 55, and a portfolio is proposed only above the minimum portfolio Assessment, 60 to start with: both values can be adjusted with the slider. The 15 metrics, group by group.
The bands of the three columns are starting values adjustable with the sliders; the way each column picks its winner stays fixed. Next to the best proposal the Composer shows the equivalent alternatives: in the closed years they share, the first does not win in all of them (with fewer than three years, the precision of the score decides), so on the score they can't be told apart, and the choice can rest on other reasons (fewer profiles, less capital…).
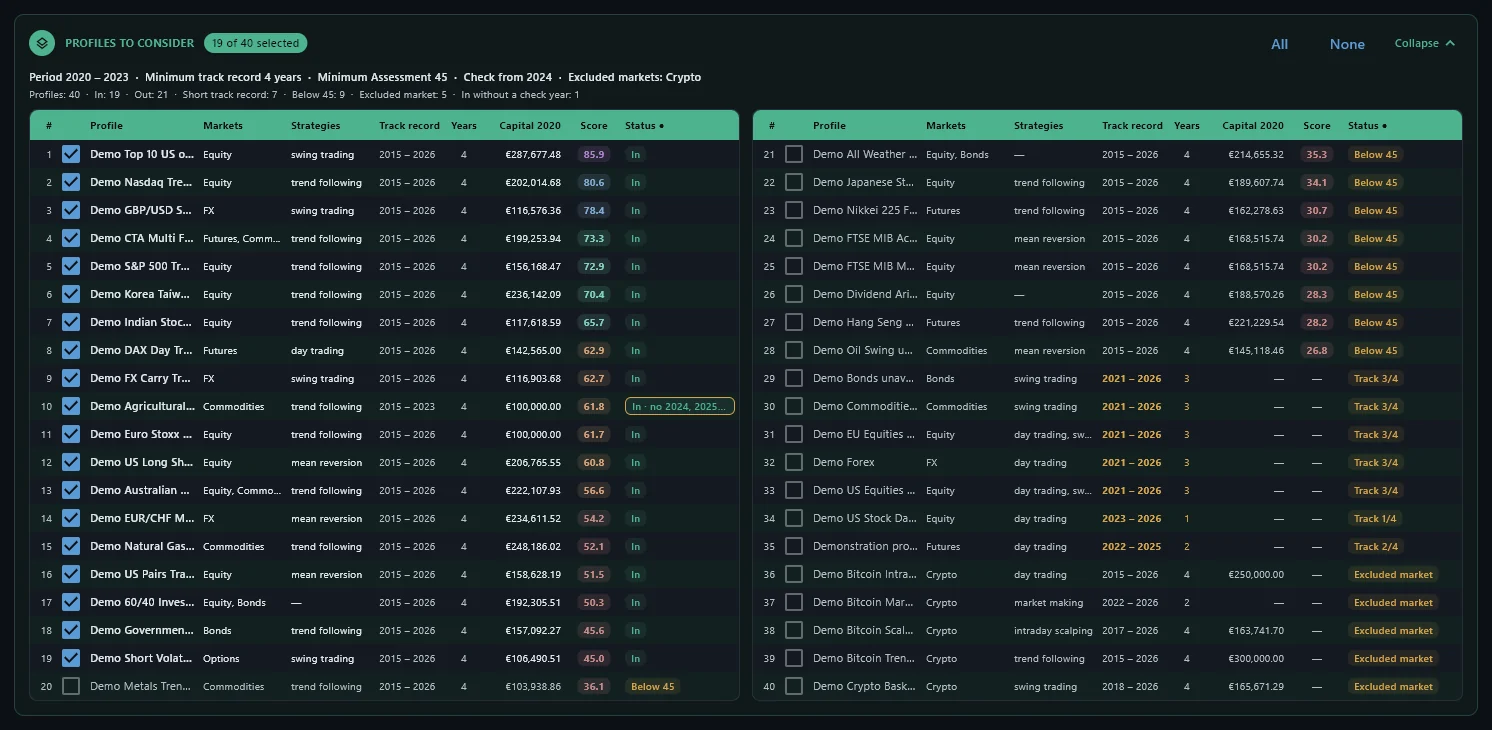
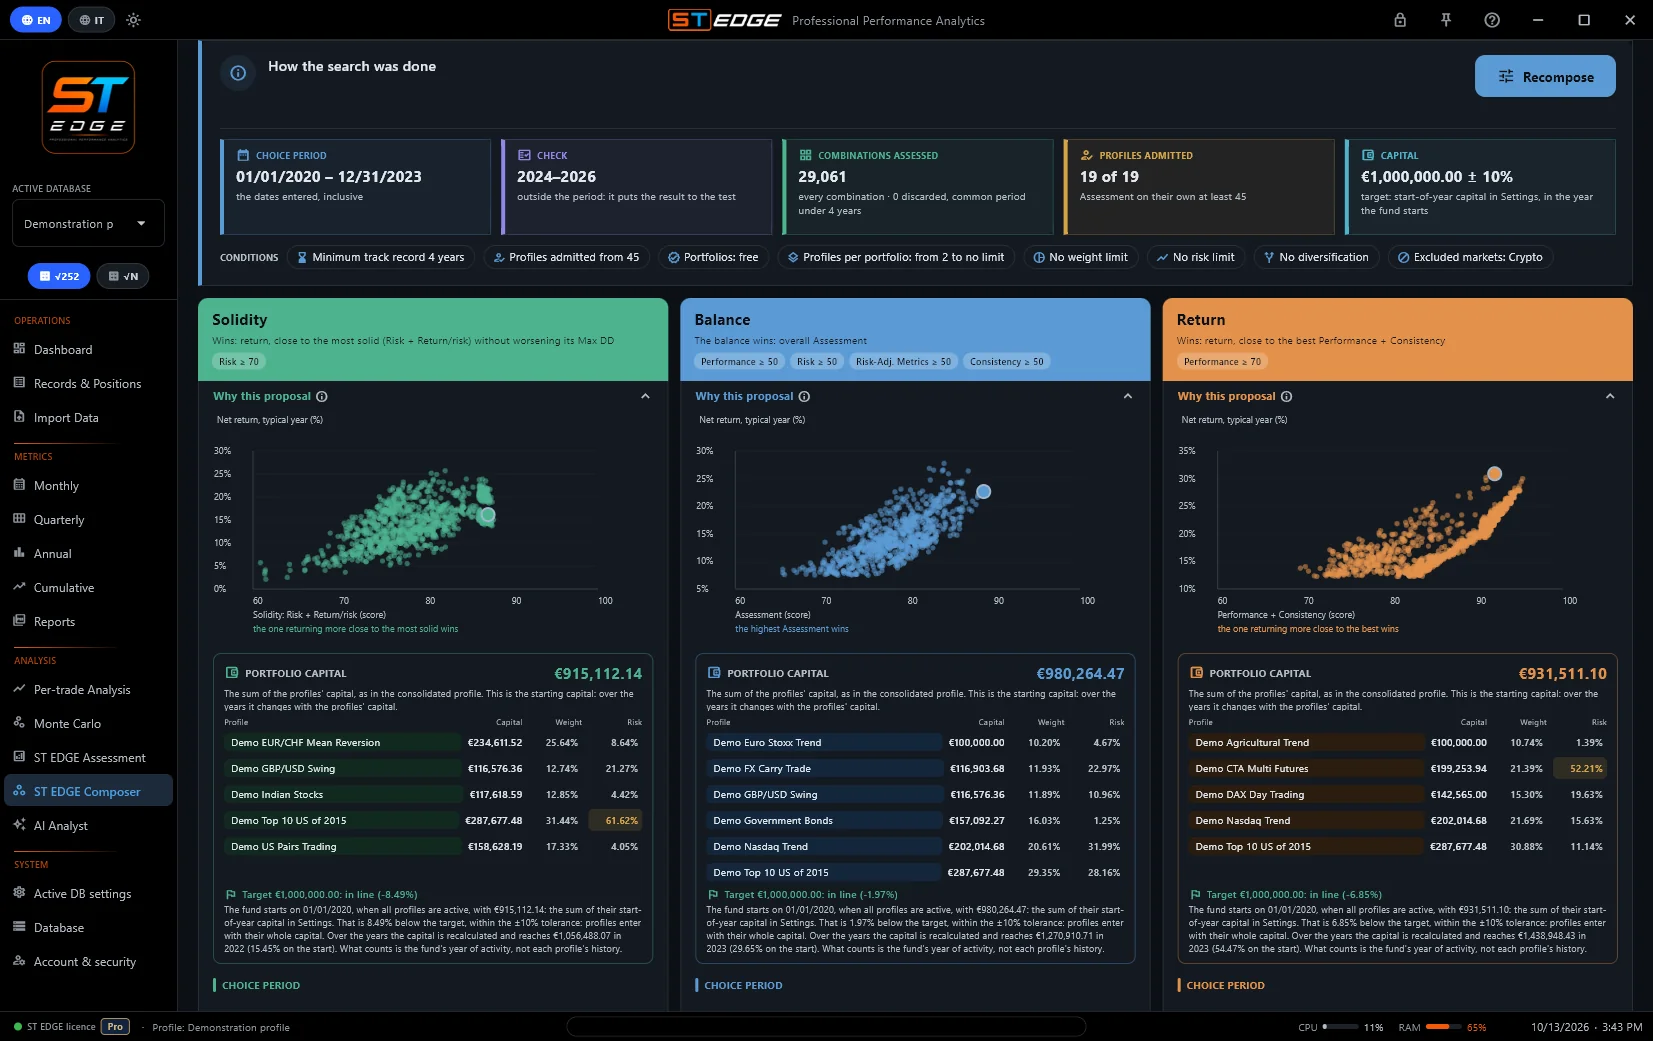
A real search on the forty sample profiles. Six have simulated data: five «Demo …» profiles and the «Demonstration profile», the only one that comes installed with ST EDGE. The others apply a mechanical rule to real market prices, chosen already knowing the history: they're there to put the app to the test and prove no forecasting ability. Selection period 2020–2023, minimum history of 4 years, profiles admitted from an Assessment of 45, minimum portfolio Assessment free, 2 profiles or more, crypto excluded and the check turned on for the following years. The capital is a target: with «Commit the capital» the portfolio has to start with €1,000,000, give or take 10%. Nineteen profiles get in, and 29,061 combinations are evaluated.
How to choose. 86.5, 88.8 and 85.9 look like close scores, but the real difference shows in the year-to-year band: Solidity goes from 72.5 (2022) to 91.3 (2021), Balance from 85.5 to 89.6, Return from 56.5 (2023) to 90.7. Balance is the most regular: even in its worst year it stays above 85. After that, it comes down to priorities. Solidity keeps the Max DD under 3%, but a single profile carries more than half of the risk. Return earns the most, with a much weaker year and a profile that stops before the end. Balance sits in the middle, and it's also the one with the most evenly spread risk.
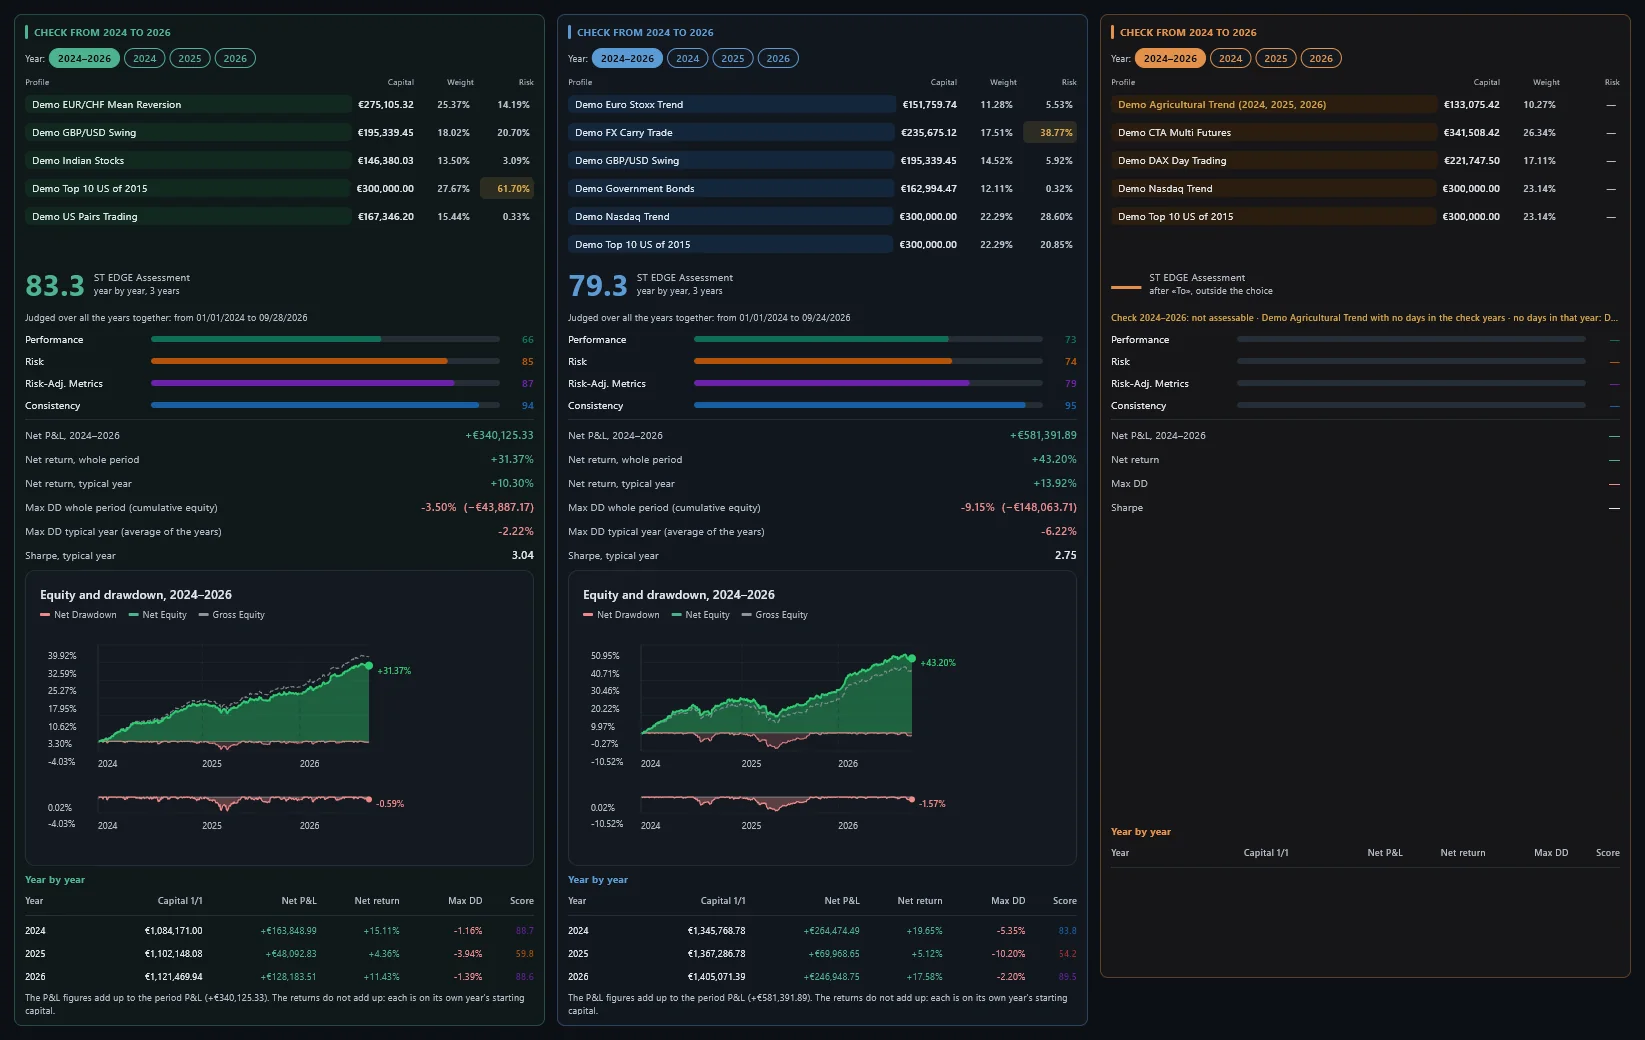
The check (2024–2026). On the years after the choice the Assessment is 83.3 for Solidity and 79.3 for Balance, while Return gets no score: Agricultural Trend has no days in those years, so that portfolio can't be measured, and the check says so. The other two hold up, but the year-by-year table shows a weaker 2025: 59.8 for Solidity and 54.2 for Balance, which that year reaches a Max DD of −10.20%. The risk shifts too: in Balance, FX Carry Trade rises to 38.77% of the swings. That is what the check must show: over how many years, with which profiles, and who carries the risk.
It's an analysis of the past, not a forecast. Among many combinations one always looks best, sometimes just by chance, which is why there are minimum thresholds, a check on the later years and equivalent alternatives. Profiles are added up as if they were in the same currency: ST EDGE doesn't convert anything, and every document for the consolidated profile points this out. Consolidated profiles and the Composer are part of the Pro and EDU plans, and during the beta every account has the Pro plan.
The beta is free until 31 March 2027 with every feature open. Every screen is explained in the manual.